Setting Up Grafana to use Collectd and InfluxDB
We’re going to continue our work after getting Collectd and InfluxDB working together. After that post, we should have a working setup of Collectd gathering CPU, memory and load metrices on our local Mac, and sending it to the collectd_metricsdatabase in our local InfluxDB.
We’re now going to set up Grafana.
Grafana is a visualisation tool that allows us to turn metrics data from several data sources into graphs and charts. It currently supports getting data from Graphite, InfluxDB, OpenTSDB, Prometheus, Elasticsearch, and CloudWatch. It works very simply. You provide connection details to the above data sources, specify queries for gathering data for graphs, customise the look and feel, and add the graph to a dashboard. There are other nifty features that Grafana provides, such as exporting, importing, and sharing dashboards, along with the ability to send a snapshot of the dashboard to someone else so that they can view the data without having access to your dashboard. You can also configure authentication using Google OAuth, LDAP, etc. It has a bunch of other features I won’t go into here. But for now, let’s get started and plot the metrics our current Collectd and InfluxDB set up is collecting.
Installing Grafana
The installation docs for Grafana are here. On Mac OS X Seirra, installing it is as simple as running the following command:
brew install grafana
Once installed, start Grafana by running:
brew services start grafana
Accessing the dashboard
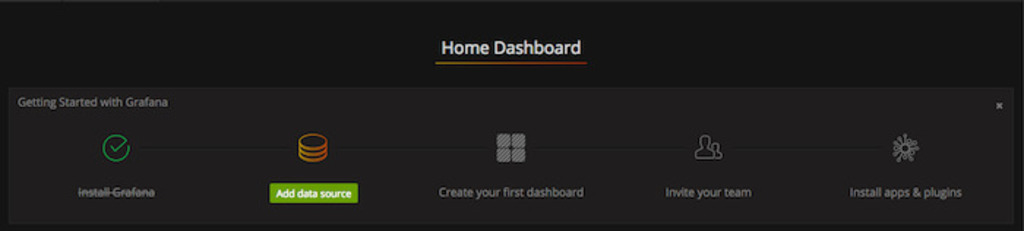
Once installed and started, you can access the dashboard at http://localhost:3000. The username and password are admin and admin, respectively. Once logged in, there is a very helpful wizard that walks you through setting up your data sources, which is where Grafana will pull data from, and then creating a dashboard.
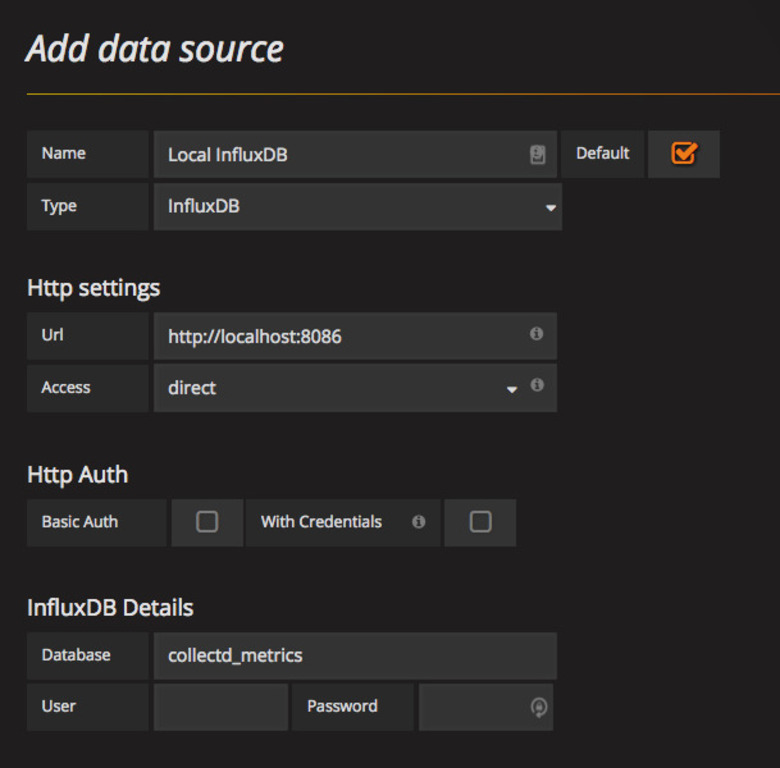
For the data sources, configure the following:
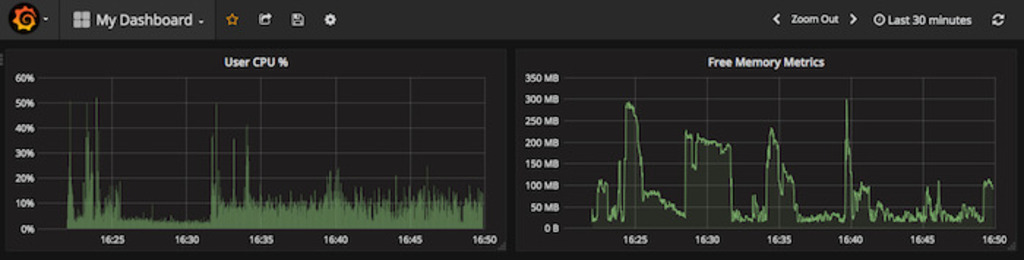
Once your data source has been added, you can begin creating dashboards. I wont’ highlight the process here, since its a fairly simple GUI that you can explore. Try to set up something like this:
Wrapping It Up
This covers a very basic set up of Grafana. What we’ve accomplished is that on our local Mac we’ve set up Collectd to gather metrices for CPU, load and memory, and stored them all in InfluxDB. From there we were able to configure Grafana for charting and plotting. This is a very basic monitoring pipeline for reporting and analytics that is very essential to DevOps.
Resources

Help me fuel up so I can keep typing typing typing...
&emoji=☕&slug=ayushsharma&button_colour=FFDD00&font_colour=000000&font_family=Cookie&outline_colour=000000&coffee_colour=ffffff)